Scatterplot
When I want to visualize a relationship between two variables (possibly third as well)
import numpy as np
import pandas as pd
import os
from IPython.display import display, Image
import plotly.graph_objs as go
import plotly
merge = pd.read_csv('../data/scatter-1.csv')
fig = go.Figure(data=go.Scatter(
    y = merge['homebuyers'],
    x = merge['mean_age'],
    mode='markers',
    marker=dict(
        size=8,
        color=merge['household_count'], # set color equal to a variable
        colorscale='Viridis',
        showscale=True
    )
))

# Plot labels
fig.update_layout(title='',
                  xaxis_title='Average Age',
                  yaxis_title='Total Homes Bought',
                  annotations=[

                  ],
                 shapes=[])

fig.show()
Image(filename='../images/scatter-figure-1.png')
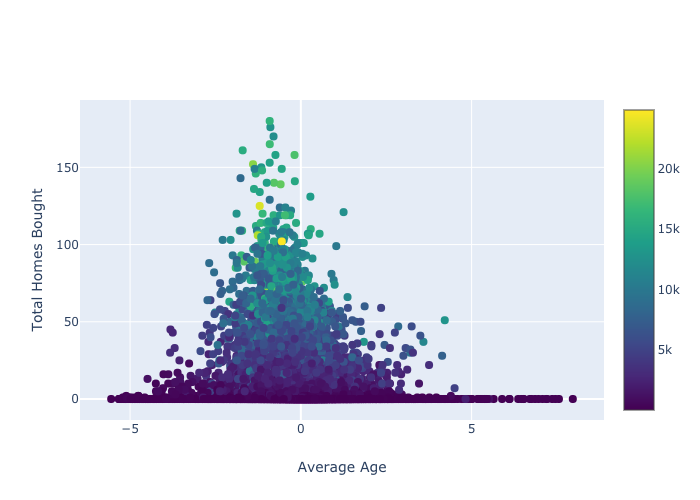
So pretty!
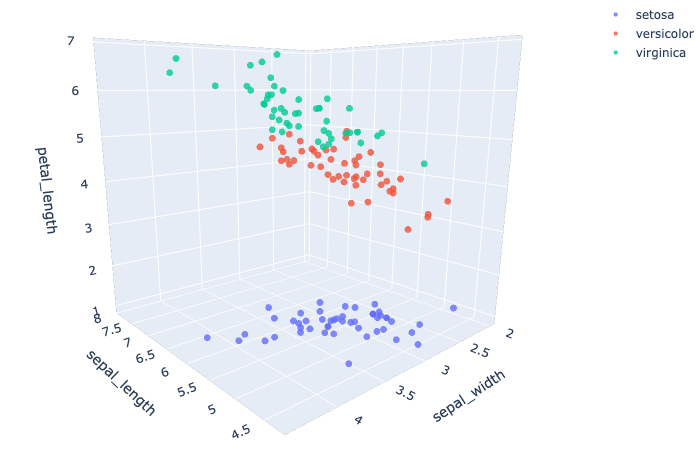
df = plotly.data.iris()
setosa = go.Scatter3d(
    x=df.loc[df['species'] == 'setosa'].loc[:, 'sepal_length'],
    y=df.loc[df['species'] == 'setosa'].loc[:, 'sepal_width'],
    z=df.loc[df['species'] == 'setosa'].loc[:, 'petal_length'],
    mode='markers',
    marker=dict(
        size=4,
        opacity=0.8
    ),
    name='setosa'
)

versicolor = go.Scatter3d(
    x=df.loc[df['species'] == 'versicolor'].loc[:, 'sepal_length'],
    y=df.loc[df['species'] == 'versicolor'].loc[:, 'sepal_width'],
    z=df.loc[df['species'] == 'versicolor'].loc[:, 'petal_length'],
    mode='markers',
    marker=dict(
        size=4,
        opacity=0.8
    ),
    name='versicolor'
)

virginica = go.Scatter3d(
    x=df.loc[df['species'] == 'virginica'].loc[:, 'sepal_length'],
    y=df.loc[df['species'] == 'virginica'].loc[:, 'sepal_width'],
    z=df.loc[df['species'] == 'virginica'].loc[:, 'petal_length'],
    mode='markers',
    marker=dict(
        size=4,
        opacity=0.8
    ),
    name='virginica'
)

data = [setosa, versicolor, virginica]

layout = go.Layout(
    margin=dict(
        l=0,
        r=0,
        b=0,
        t=0
    ),
    scene={"aspectmode": "cube",
           "xaxis": {"title": "sepal_length", },
           "yaxis": {"title": "sepal_width", },
           "zaxis": {"title": "petal_length", }}
)

fig = go.Figure(data=data, layout=layout)
fig.show()
Image('../images/scatter-figure-2.png')